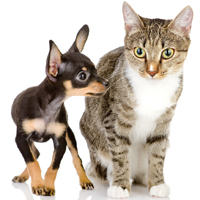
According to the U.S. Pet Ownership & Demographics Sourcebook by the American Veterinary Medical Association (AVMA), the state of Arkansas has the highest percentage of households that own a dog and Vermont the highest that own a cat. States that own the fewest dogs and cats are also named.
The study was conducted in 2012, but is based on numbers from December 31, 2011; results are drawn from a survey of more than 50,000 households in the United States.
| Top 10 pet-owning states (percentage of households that owned a pet): | The 10 states with the fewest pet-owning households (percentage of households that owned a pet): |
| 1. Vermont: 70.8% | 1. Rhode Island 53% |
| 2. New Mexico: 67.6% | 2. Minnesota: 53% |
| 3. South Dakota: 65.6% | 3. California: 52.9% |
| 4. Oregon: 63.6% | 4. Maryland: 52.3% |
| 5. Maine: 62.9% | 5. Illinois: 51.8% |
| 6. Washington: 62.7% | 6. Nebraska: 51.3% |
| 7. Arkansas: 62.4% | 7. Utah: 51.2% |
| 8. West Virginia: 62.1% | 8. New Jersey: 50.7% |
| 9. Idaho: 62% | 9. New York: 50.6% |
| 10. Wyoming: 61.8% | 10. Massachusetts: 50.4% |
Note: The District of Columbia’s pet ownership rate was the lowest at 21.9 percent.
| States with the most dog owners (percentage of households that owned a dog): | States with the fewest dog owners (percentage of households that owned a dog): |
| 1. Arkansas: 47.9% | 1. Illinois: 32.4% |
| 2. New Mexico: 46% | 2. New Jersey: 32.4% |
| 3. Kentucky: 45.9% | 3. Minnesota: 31.9% |
| 4. Missouri: 45.9% | 4. Maryland: 30.8% |
| 5. West Virginia: 45.8% | 5. New Hampshire: 30.3% |
| 6. Mississippi: 45.2% | 6. Utah: 29.4% |
| 7. Alabama: 44.1% | 7. Rhode Island: 29.3% |
| 8. Tennessee: 44.1% | 8. New York: 29% |
| 9. Texas: 44% | 9. Connecticut: 28.3% |
| 10. Oklahoma: 43.2% | 10. Massachusetts: 23.6% |
Note: The District of Columbia’s dog ownership rate was the lowest at 13.1 percent.
| States with the most cat owners (percentage of households that owned a cat): | States with the fewest cat owners (percentage of households that owned a cat): |
| 1. Vermont: 49.5% | 1. California: 28.3% |
| 2. Maine: 46.4% | 2. South Carolina: 27.8% |
| 3. Oregon: 40.2% | 3. Rhode Island: 27.6 |
| 4. South Dakota: 39.1% | 4. Alabama: 27.4% |
| 5. Washington: 39% | 5. Florida: 27.3% |
| 6. West Virginia: 38.1% | 6. Georgia: 27.3% |
| 7. Kentucky: 36.8% | 7. Illinois: 26.3% |
| 8. Idaho: 34.6% | 8. Louisiana: 25.9% |
| 9. Indiana: 34.4% | 9. New Jersey: 25.3% |
| 10. New Hampshire: 34.2% | 10. Utah: 24.6% |
Note: The District of Columbia cat ownership rate was the lowest at 11.6 percent.
These statistics are but a sample of what the complete report has to offer. To order the U.S. Pet Ownership & Demographics Sourcebook for 2012, visit the American Veterinary Medical Association website.


